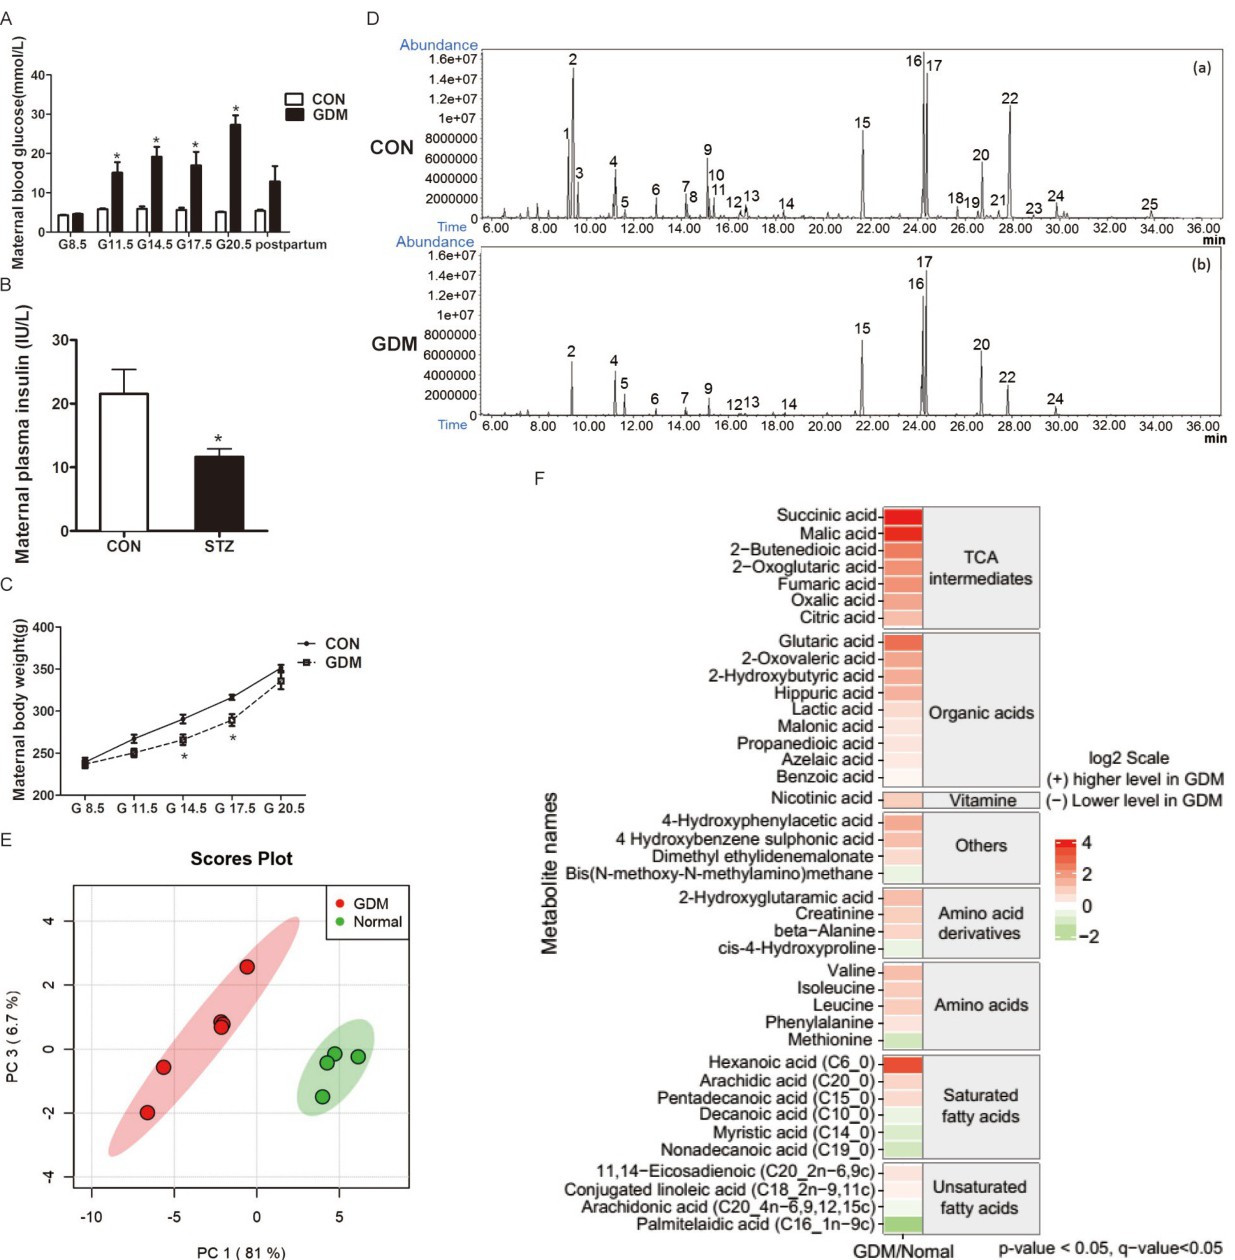
Fig. 1. STZ induced hyperglycemia and metabolic disturbance in pregnant rats. (A) Maternal blood glucose levels, (B) maternal plasma insulin on G17.5, (C) maternal body weight after STZ treatment, (D) representative GC-MS chromatogram of plasma metabolite profile of mice with (a) GDM and (b) normal pregnancy. Succinic acid (Peak 1), lactic acid (Peak 2), Caprylic acid (Peak 3), D4-alanine (Peak 4- internal standard), glycine (Peak 5), valine (Peak 6), leucine (Peak 7), isoleucine (Peak 8), silane (Peak 9), proline (Peak 10), pentanedioic acid (Peak 11), citric acid (Peak 12), asparagine (Peak 13), glutamate (Peak 14), 10,13-dimethyltetradecanoic acid (Peak 15), conjugated linoleic acid (Peak 16), stearic acid (Peak 17), 2,4,6(1H, 3H, 5H)-pyrimidinetrione (Peak 18), lysine (Peak 19), arachidonic acid (Peak 20), histidine (Peak 21), EDTA (Peak 22), tyrosine (Peak 23), DHA (Peak 24), and ethyl 8-amino-6-methoxycinchoninate (Peak 25), (E) principal component analysis (PCA) of metabolites identified from CON and GDM sera; principal components PC1 and PC3 explicate 81% and 6.7% of the variance, respectively, (F) differences in maternal plasma metabolome. The results are the mean ± SEM, n=4 in CON and n=6 in GDM, * p<0.05.